Why do you need to know everything about updated web design statistics? It will add more advantages to your business. How? Don’t think. Let us know. The world is currently in the midst of a journey, where many physical things and tasks are evolving digitally, which will help decrease human effort and increase the availability of more attractive and comfortable services.
Getting Web design statistics for new designs is also challenging nowadays. This blog post is basically offered to provide you with some amazing Web Design statistics.
The post included some vital and acknowledgeable stats, with the help of which you can make your digital platform more suitable as per the running trend. Apart from developing, a web platform is all about web designing, responsive designing, and graphic designing.
These three are the most important pillars of a web platform, as we know very well that the design of any website leaves the first impression on any user.
Specifically, web design of any website is experiencing rapid and drastic changes, which is important because no one wants to see the same old design again and again, so it is really very necessary to change the way of design along with time. If you are looking for a professional and creative web design service, you can hire a website designer in India from some of the best web design companies listed in this post.
For Any Enquire, Request a Free Quote
Web Design Trends in 2026
Be sure to improve your user experience by using these web design trends in 2026.
Coming next to responsive design, it has become one of the most important factors for any website after 2015, as Google has started giving priority to websites that are mobile responsive too.
The giant search engine has taken this step after looking at the enhancement in the number of smartphone users across the whole world.
Lastly, there is graphic designing, which is used to make your website more attractive and ravishing.
All of these design techniques are experiencing intense changes, which are also important in this rapidly changing technology.
The Jaw-Dropping 104 Web Design Statistics of 2026 You Should Not Ignore!
These are some web design statistics, which you can follow and make your website more advanced as per the current trend:
1. 39%-53% of people across the world will stop engaging with a website if images won’t load or take too long to load (e.g., over 2–3 seconds).
2. Desktop internet usage has dropped by ~39% – 41% in the time period between December 2013 and December 2025 globally.
3. A single second of added page load speed can cause sales to drop by 7-20% in e-commerce conversion rates.
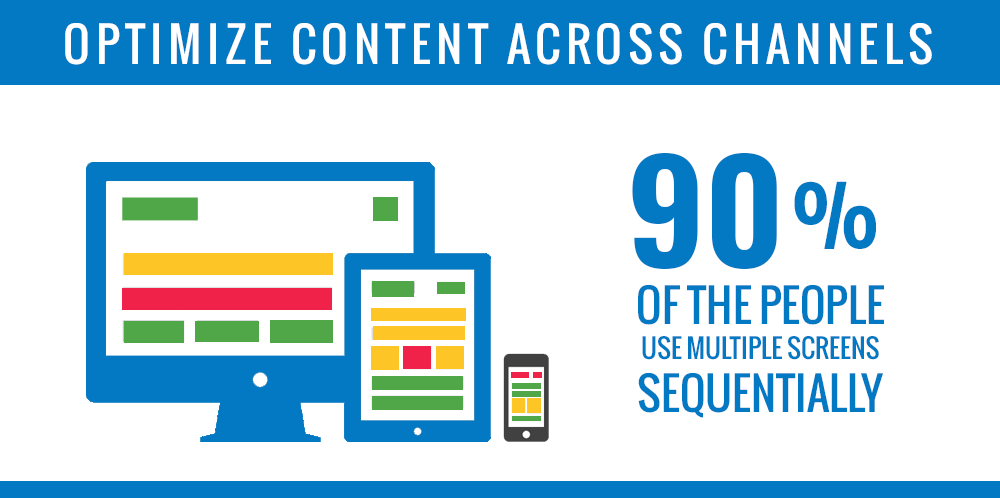
4. On average, 60–90% of global consumers (with regional variations) reportedly multi-screen using 2 devices at the same time in 2026.
5. Web Pages, which loaded in 1-2 seconds, experienced a great mobile conversion rate of 3-5% in 2026.
6. Average connection speed gets a hike of 14% every year; it was 6.1 Mbps in Q2 2016- Akamai. By 2026, the average global internet speeds are set to reach about 85 Mbps for fixed connections and around 50 Mbps for mobile devices.
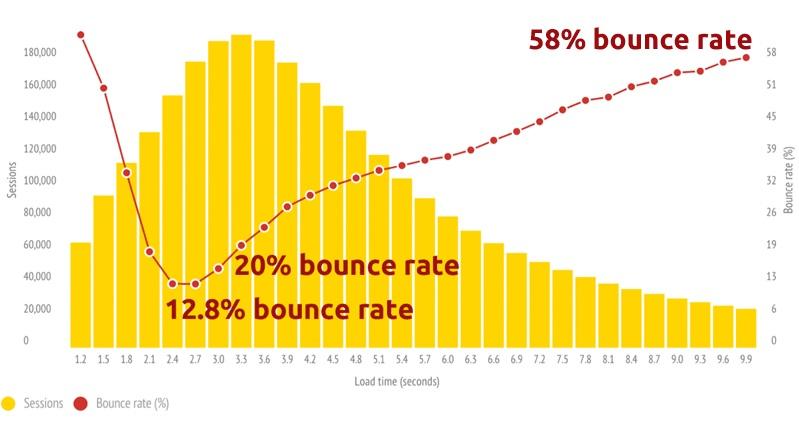
7. Web pages that load in 2.4 seconds had a bounce rate of 12.8%, whereas the pages that load in 3.3 seconds experienced a bounce rate of 20%- Soasta.
8. A regular optimization of any website will result in a 113% jump in visits and a 117% increase in clicks on that site.
9. On average, 8 out of 10 consumers would stop engaging with a site if its content doesn’t display properly on their device- Adobe
10. Nearly two-thirds of people would rather read beautifully designed content instead of something expressed plainly.
11. 38% of people would stop using a website if its content/layout is unattractive.
12. 48% of people mentioned a website’s design is the most important factor in deciding the credibility of a business.
13. You mostly have just 10 seconds to leave an impression on the user, after this (oftentimes before) he/she will leave.
14. 47% of people expect a web page to load in 2 seconds or less.
15. 64% of total visitors want to see the company’s contact information on its homepage.
16. 44% of total website visitors will leave a company’s website if there’s no contact info or contact number given.
17. Peer-created content is less likely to be questioned.
18. 62% of companies increased their sales by designing responsive mobile platforms for their websites.
19. 40% of people will switch to a different search result if the first one is not mobile-friendly.
20. 48% of users say if the business side of a company is not mobile-friendly, they’ll take it as an indication that the business is simply not caring.
21. According to the latest GWI data, 86–90% of people use multiple screens sequentially in 2024.
22. Mobile devices now spend nearly 2 of every 3 minutes (59.6–63.38%) online, according to Statista’s 2025 data.
23. According to Ericsson, global mobile data traffic surged by 20–25% year-on-year in 2024-2025.
24. According to a 2024 report by Pew Research, 90% of adults in the United State have a smartphone, and 95% are using the internet. It’s interesting to note that mobile devices are the primary way people access the web, with a staggering 96.2% of internet users doing so via their mobile phones, including smartphones.
25. Smartphone users check their smartphones about 80-144 times a day.
26. Google started giving preferences to responsive websites in its search engine results pages in April 2015.- Google
27. According to some reports, ~20–27% of total small businesses do not have a responsive, mobile-optimized website – Zippia
28. 94% of people mentioned web design as the major reason they mistrusted or rejected a website.
29. After reaching a company’s website via a referral site, nearly 36% of visitors will click on the company’s logo to reach the home page. – KoMarketing
30. 82% of consumers trust a company after reading custom content. – Demand Metric
31. Better search engine rankings result in an approximately 26% increase in organic traffic. -Moz
32. 78% of respondents stated that the company’s social media posts impact their purchases – Forbes
33. Worldwide B2C e-commerce sales reached $ 1.7 trillion in 2015 and are expected to reach $ 2.35 trillion by 2018.
34. 8 out of 10 consumers will choose online shopping if free shipping is offered.
35. A hike from 8 to 2 seconds in site speed can boost your conversion rate by up to 74%.
36. 40% of smartphone and tablet owners search for B2B products on their devices – KoMarketing
37. Half of the world’s total population now has a mobile subscription, and an additional one billion subscribers are predicted by 2022. After that, the Global penetration rate of mobile subscriptions will be approximately 65.- GSMA
38. Almost 60% of the internet is accessed by mobile – InMobi
39. The number of mobile owners is also growing rapidly. In 2011, 35% of US adults owned a smartphone, which increased to 68% in 2015.- Pew Research Centre
40. Several experts estimated that 2.6 billion people, which is 1/3rd of the world’s total population, will use smartphones by 2018.- eMarketer
41. 45% of all U.S. adults owned a tablet (like an iPad).- Pew Research Centre
42. Worldwide, consumers use an average of 5 different devices per person, with different screen sizes and device types. Moreover, they also use 2.23 devices simultaneously on average – Adobe
43. 65% of consumers across the globe ranked display as the “most important aspect” when they were asked to consume content in their personal lives.
The display even left the layout and personalization part behind with 54% and 49% respectively – Adobe
44. Responsive design of a website can also help with emails and in increasing the number of clicks from 5% to 15%- MailChimp
45. 34% of smartphone users go online mostly by using their smartphones.
46. A non-responsive site is a back button magnet.
47. 4 out of 5 smartphone users access retail content on their device monthly.
48. Google started rewarding sites, which were built responsively for multi-device support on April 21, 2015.
49. This major update was known throughout the Internet as Mobilegeddon.
50. Out of 100 sites analyzed, only 11.8% on average use responsive design.
51. Judgments on website credibility are 75% based on a website’s overall aesthetics.- InvisionApp
52. 70% of the total small business websites do not have a Call to Action on their home pages.
53. 85% of Website Visitors expect the mobile version of the website to be a bit faster.
54. 47% of users expect a maximum of 2 seconds of loading time for an average website.
55. In a duration of 15 minutes, about 66% of users will prefer beauty over plain design.
56. 38% of people will leave a website if it fails to deliver attractive content/layout.
57. 48% more traffic is produced from websites which have 51-100 pages.
58. The average size of a web page is now larger than the original Doom’s install image (2MB).- mobiforge.com
59. 17% of all websites use RWD, while 21% use mdot or .mobi – Marketing Land
60. 82% of the top 100 Alexa websites use adaptive design – mobiforge.com
61. The average conversion rate on mobile is over 3x lower than on desktop-monetate.com
62. 48% of the visitors voted website design as the number one factor affecting the credibility of the website.
63. 72% of people trust online reviews and make their purchase decisions.
64. Sales of the companies boosted, which developed their website for mobile platforms, and 64% of sales increased for the companies, which designed their websites for tablets.
65. 45% of users abandoned the front page if the loading time of the page increased by 3%.
66. 94% of the visitors closed websites and stopped trusting the site if it has a degraded web design.
67. Content marketing generates 3 times as many leads as traditional outbound marketing, but costs 62% less – Hubspot
68. 49% of websites based on HTML5 get higher page views than simple sites.
69. Use of intense colours increased web recognition to around 80%. Websites that use dark colours experienced 2% growth, whereas light colour-themed sites experienced 1.3% growth.
70. Content with bullet lists engaged 70% of the users, whereas 55% of customers were engaged with content which lacked bullet listings.
71. Users typically form an opinion within .05 seconds after jumping on your website – Kinesis Inc.
72. Bounce rate spiked to 150% when the page load time was 8 seconds, and 100% when the page load time was 4%.- Mobile Joomla
73. 80% of marketers consider increasing overall conversion a dominating factor in the priority of web optimization programs – Marketing Sherpa
74. 78% of the visitors opted for online purchases when they get excellent customer service – Econsultancy
75. According to 72% of marketers in North America, personal content marketing plays a vital role in the success of their website – Marketing Charts
76. 68% of the companies that developed the mobile-first website experienced an increase in their sales – Econsultancy
77. 80% of the visitors sequentially use multiple screens – user flip
78. 95% of the visitors agreed that good user experience is everything that really matters – Econsultancy
79. Mobile users now make up around 27% of the total web usage – Smart Insights
80. $1.1 trillion sales in 2011 were web-influenced – Forrester Research
81. Using dark colours on a website can be more beneficial as compared to light colours, as it increases traffic (2% vs 1.31%), page views (2.98% vs 2.91%), bounce rate (44.4% vs 46.2%), and average time on the site (3.18 seconds vs 3.15 seconds).- Visually
82. A study of Fortune 500 websites showed that 63% have content above the fold, 50% feature a scrolling content window of some kind, 63% use high-quality images that connect with their users, and the average loading time is 6.5 seconds – Go-Globe.com
83. 47% of website visitors check out a company’s products/services page before accessing any other sections of it – KoMarketing
84. After jumping on a company’s homepage, 64% of visitors check out the company’s contact information – KoMarketing
85. After jumping on a company’s homepage, 52% of visitors want to see “about us” information – KoMarketing
86. After getting redirected to a company’s website via a referral site, 50% of visitors use the navigation menu to orient themselves – KoMarketing
87. 67% of shoppers showed more interest in buying from a website if it is compatible with mobile devices.
88. 4 out of 5 consumers shop on smartphones.
89. More than 80% of marketers consider increasing overall conversion a dominant priority for their website optimization programs – MarketingSherpa
90. Only 22% of marketers say they’re ahead of the curve when it comes to responsive design. 29% say they have an “average” experience level, 23% say they’re behind the times, and 4% say they’re hopeless – eMarketer
91. Only 55% of companies are currently conducting online user experience testing – Econsultancy
92. 47% of marketers indicated that their web design or product development actually changed as a result of optimization lessons – MarketingSherpa
93. 46% of mobile users report having difficulty interacting with a web page, and 44% complain that navigation was a bit difficult.
94. 47% of people expect a web page to load in two seconds or less – Econsultancy
95. 82% of consumers feel more positive about a company after reading custom content- Demand Metric
96. Judgments on website credibility are 75% based on a website’s overall aesthetics – InvisionApp
97. 39% of users abandon a website if images don’t load or take a time to load.
98. 48% more traffic is produced from websites that have 51-100 pages.
99. 82% of the top 100 Alexa websites use adaptive design – mobiforge.com
100. 85% of Website Visitors expect the mobile version of the website to be faster.
101. 38% of people will leave a website if it fails to produce attractive content/layout.
102. The active number of websites on the internet across the globe has reached 543 million in 2021.
103. 90% of the visitors left a particular website in just 3 seconds because of its poor design.
104. 71% of the brands believe word-of-mouth marketing is the best way to find new clients online in 2022.
105. According to a Vodafone case study, there was an 8% increase in sales driven by a 31% improvement in LCP (Largest Contentful Paint).
106. According to a March 2025 compilation of case studies, Akamai analysed 10 billion visits to retail websites and found that 53% of mobile shoppers ditch pages that take longer than 3 seconds to load. It’s interesting to note that even slight delays, just a few milliseconds, can really affect conversion rates.
These are the statistics which have been obtained through deep research and case studies.
By following these points or working according to these stats, you can enhance the consumer or user base of your website.
The enhancement of your user base will undoubtedly result in an increase in revenues as well as your popularity.
Hence, by this, we can also see that the design of a website plays a major role in your digital business platform, as we all must have heard the saying, “The first impression is the last impression”.
Thanks for reading the 104 Web Design Statistics. If you have any issues related to the content or information on this blog or if you want to share a suggestion, then feel free to leave a comment below.
One of our team members will get back as soon as possible. If you are interested in our UI/UX, Graphics, and Web design services, then kindly contact us. Our project manager will be in touch with you soon. For the best user experience, hire mobile UX designers from our team.
Amit Gupta, who is the CEO and Founder of SAG IPL, founded this company with the vision to become the #1 provider of quality-driven and cost-effective blockchain marketing and development services in the world. As a Chartered Accountant with a keen interest in software and web development, he manages a team of over 200 professionals, comprising designers, developers, and marketers, committed to delivering top-notch web, software, mobile, and blockchain solutions to clients worldwide.
Linkedin