Visual content such as images and videos is often considered one of the best types of content for marketing. This is because visual media & content are easy to perceive and remember.
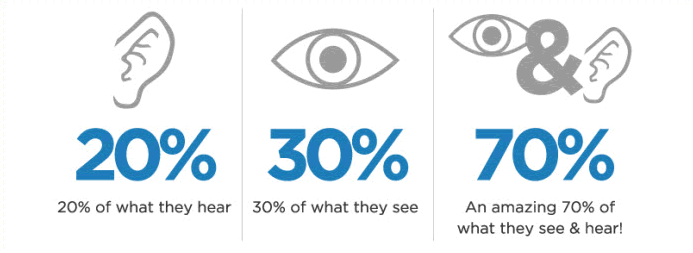
Did you know people remember around 70% of what they see & hear (videos), as opposed to only 20% of what they hear (audio) and 30% of what they see (images)?
Are you looking to learn more about such exciting visual content marketing statistics for 2026? Then, continue reading this article.
Visual content is a type of content that is perceived through seeing rather than just reading. It is imperative that what you see can remain in your memory for a longer period than what you just read.
Though images are also a type of visual content, videos have long surpassed them in popularity as a form of visual content marketing due to the incredible viewing and listening experience they offer to users. This is one of the reasons why short video apps are so popular these days, especially when included in monthly social media packages to boost engagements and reach.
Table of Contents
Why Visual Content Marketing is Important
For business owners and marketers looking to impress their customers through social media post content, visual content such as videos is a great way to create quick and long-lasting impressions on people.
Visual content is generally easy to understand and digest. It even remains in the user’s memory for a much longer period than written content.
At the same time, learning something through visual content marketing stats can be exciting and fun and is definitely far less boring than learning through text.
Learn from these awesome visual content statistics and visual social media statistics to embed social visual content in your digital marketing strategy this year to achieve better growth & success for your business.
Some of the interesting visual content marketing statistics are the following:
91 percent of communications are visual in 2023.
85% of Facebook videos are watched without sound.
89% of Marketers consider Facebook their major marketing platform.
82% of Internet traffic is represented by video content in 2023.
Landing pages with video lead to 800% more conversions (FunnelScience).
64%-85% are more likely to purchase after viewing (comScore).
40% of shoppers will even visit a store online or in person (Google).
96% of Online shoppers watch the video about a service or product.
144% Watched a video on a service or product and purchased it.
100% Videos by SEO rank 1st Page on Google, YouTube, Bing, and Yahoo.
71% of US businesses are using Instagram.
96% of B2B Companies planned to use video in their content marketing.
74% of marketers believe that content adorned with visuals will reap better business results.
Infographics are the most accepted visual content, bringing 41.5% of the user engagement for brands.
82% of internet users prefer consuming video content today.
90% of marketers now prefer using visuals in their published content.
Think About it. People remember…
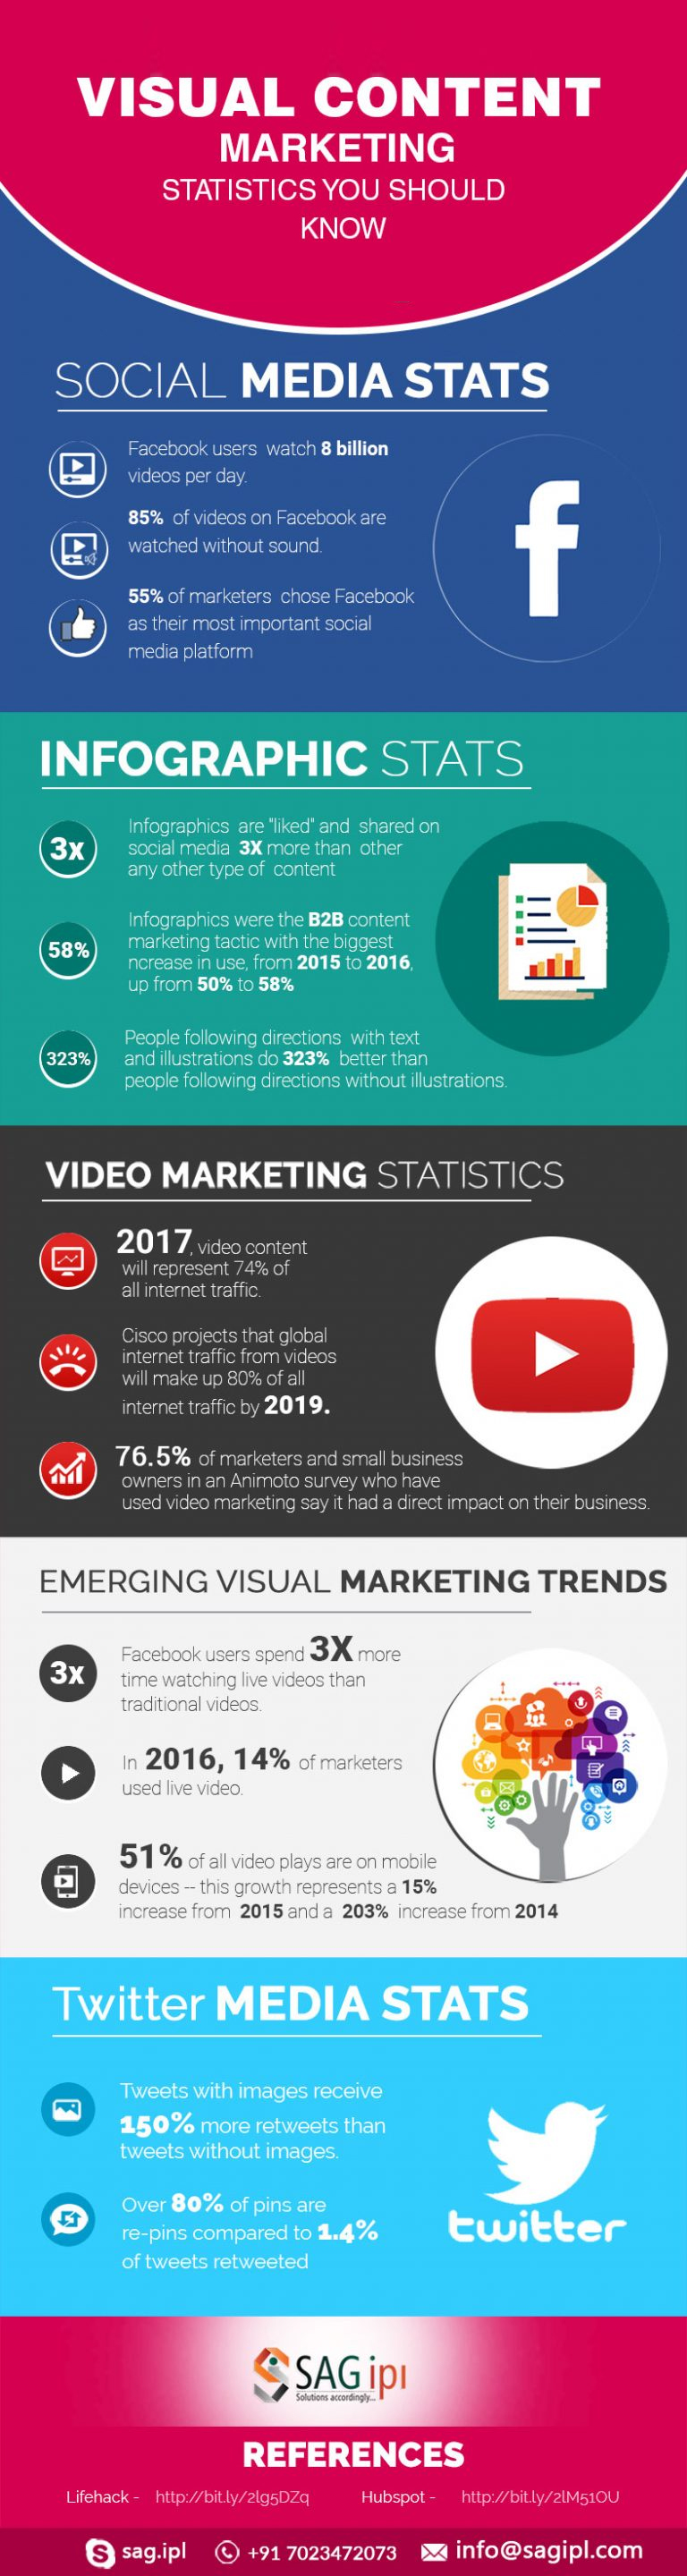
Statistical Infographic for Visual, Social Media and Content Marketing
Conclusion
As you can see, we have included many exciting visual content statistics here. To make things even better, we have also included an infographic form of these stats, which you can download and use on your own website/channel.
Make sure that visual content has a place in your digital marketing ideas in 2026. If you are wondering how to use visual elements in your existing marketing strategy or which type of visual content is the best for you, or where to post your next visual content, feel free to contact SAG IPL to talk to one of our digital or ICO marketing experts.
Need Visual Content Marketing for Your Business? Don’t Worry About It!
Mohsin Qureshi is a seasoned digital marketer with over 12 years of experience, including 7 years working as a Team Leader in SAG IPL. His expertise lies in SEO, SMO, PPC, influencer marketing, and strategy building with a focus on driving impactful results and growth for businesses. With a keen eye for innovation and a commitment to excellence, Mohsin has been delivering tailored digital marketing strategies and solutions to help businesses excel online.
LinkedIn